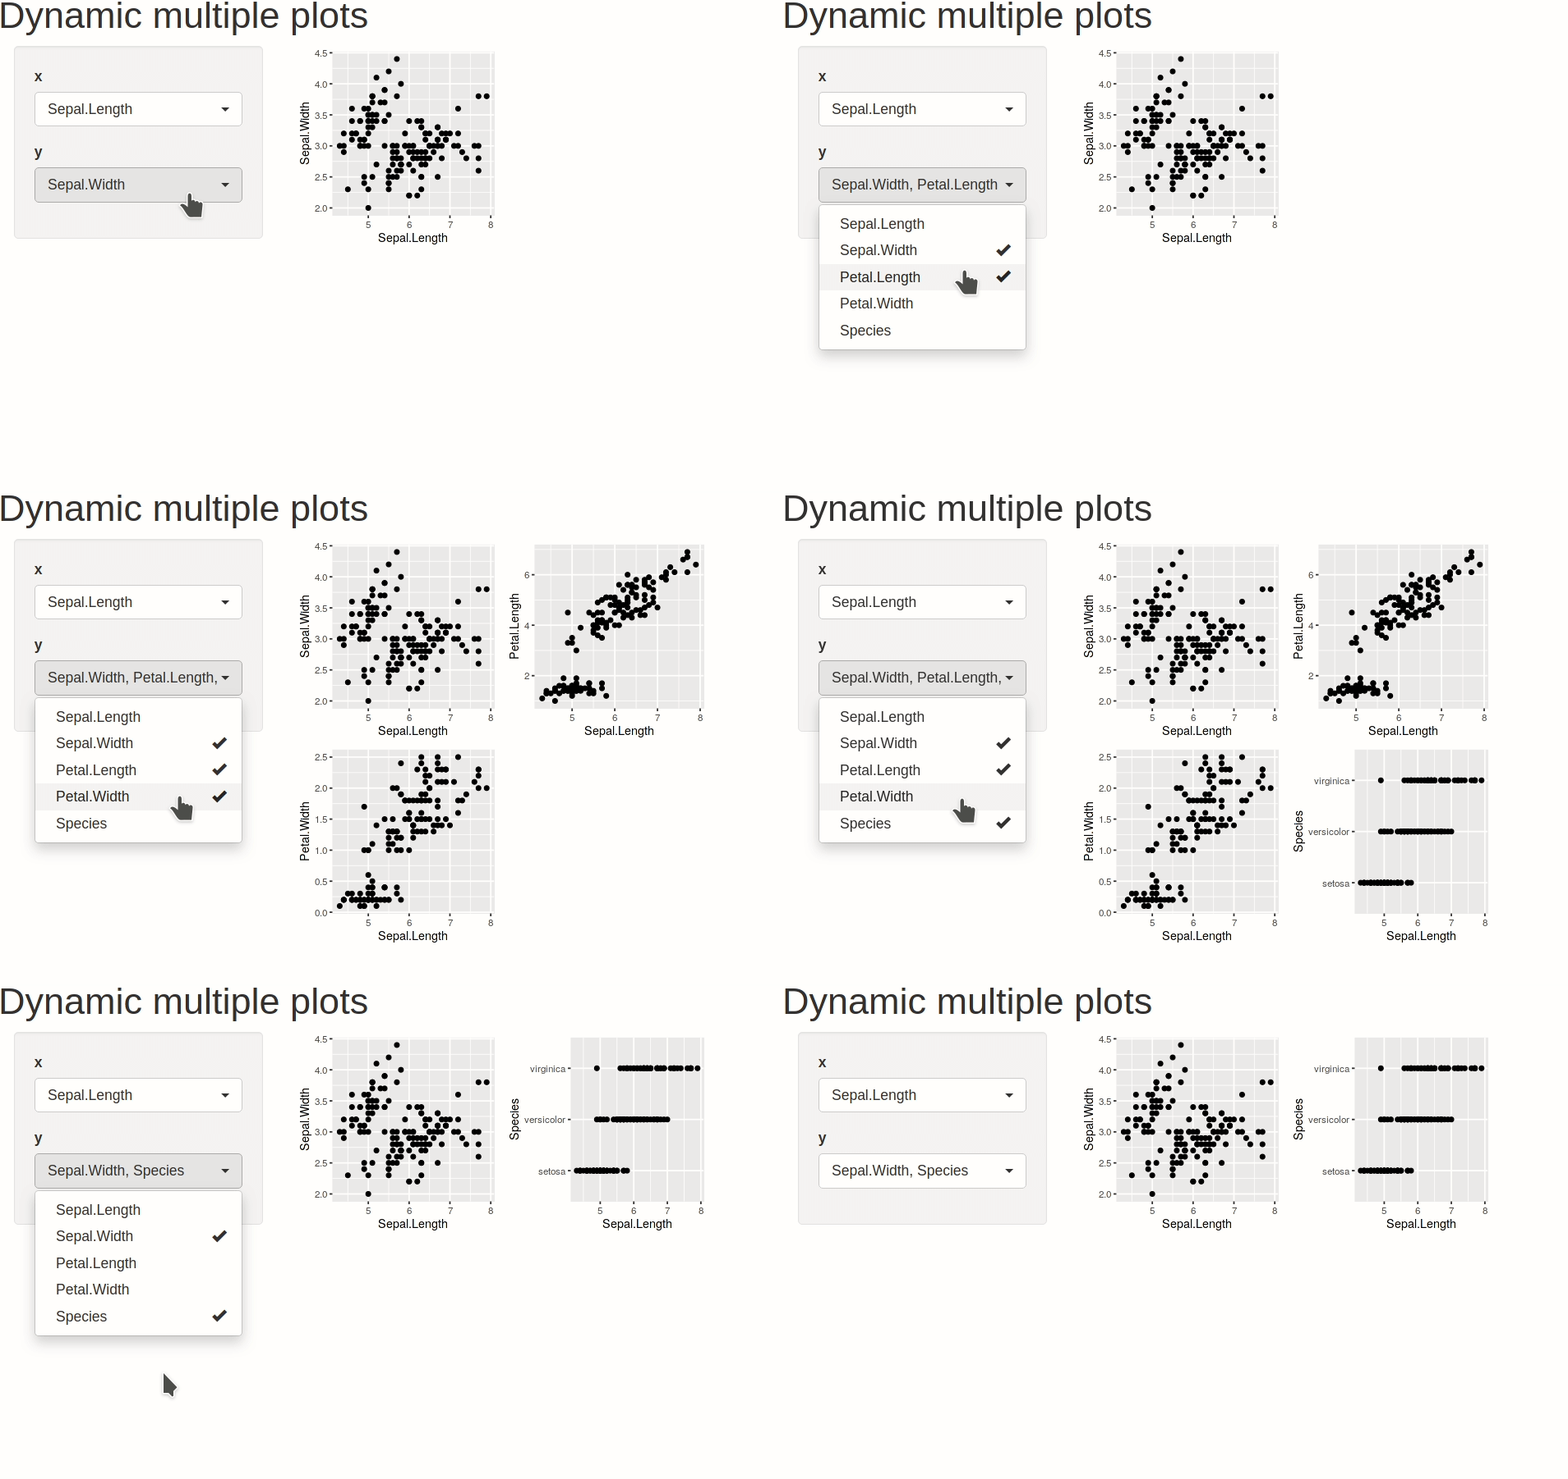
Shiny において動的にUIを生成するには,サーバーサイドで renderUI して作った UI を,UIサイドで outputUI すれば良い.
この時,renderUI の中で作ることのできる UI は一つだけではなく list あるいは htmltools::tagList で束ねた複数の UI でもよい.
この性質を利用すると,以下のように選択した変数の数に応じてプロットの数を変更できる.

複数の図を作製するには,一つずつ異なる名前を与えて output に格納する必要がある.この操作を observe の中で for ループを回しながら local 環境で行うことがポイントだ.更に local の中では for を回すためのループ変数を別の変数にコピーしてやる必要がある.
(https://gist.github.com/wch/5436415/).local や変数のコピーを行わなかった場合,同じプロットが大量に生成されてしまった.
ちなみに,各プロットを display: inline-block な div で囲んでおくと,ページ幅に合わせて図を並べてくれる.
library(shiny)
library(ggplot2)

ui <- pageWithSidebar(
  tags$h1("Dynamic multiple plots"),
  sidebarPanel(
    # shiny::selectInput より複数選択がしやすい
    shinyWidgets::pickerInput("x", "x", names(iris)),
    shinyWidgets::pickerInput("y", "y", names(iris), multiple = TRUE)
  ),
  mainPanel(uiOutput("plots"))
)

server <- function(input, output, session) {

  observe( # input$x, input$y が変更される度に処理を実行する
    for(.y in input$y) {
      local({ # local 環境にしておく必要あり
        y <- .y # .y を新しい変数にコピーしておく
        output[[y]] <- renderPlot( # 図はそれぞれ固有の ID を持つ
          qplot(!!sym(input$x), !!sym(y), data = iris)
        )
      }
    )}
  )

  output$plots <- renderUI(
    lapply(
      lapply(input$y, plotOutput, height = "200", width = "200"),
      div,
      style = htmltools::css(display = "inline-block")
    )
  )
}

runGadget(ui, server)
Enjoy!
 Atusy's blog