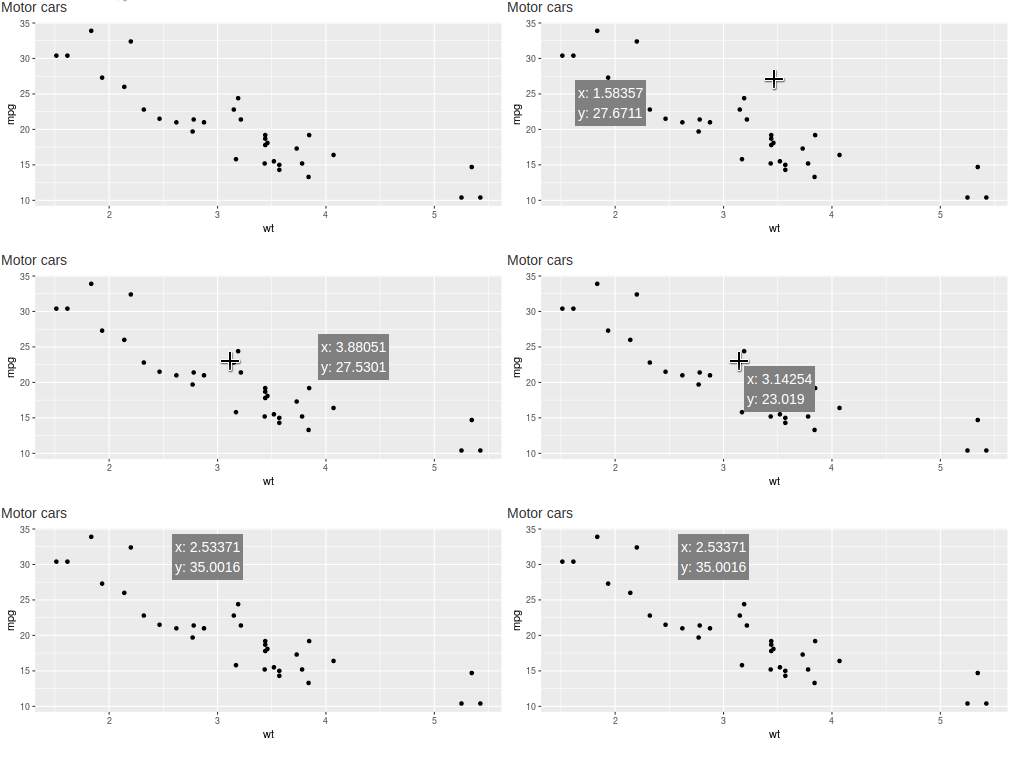
Shiny でプロットにツールチップを表示させる方法を紹介する.個人的オススメは Shiny だけで頑張ってしまう方法だ.
一番簡単な方法は plotly パッケージを使うものだが色々と制約がある.
- 大規模なプロットが遅い
type = "scattergl"やtype = "heatmapgl"など webgl を使うことである程度解消可能.
type = "heatmap"では Box select や Lasso select が使えないggplotly()を使えばggplot2を簡単にplotly化できるが,ggplot2extention に対応していない.- 例えば
ggrepelやggforce - Issue: https://github.com/ropensci/plotly/issues/566
- 例えば
など.
Shiny だけでやる

実装
library(shiny)
library(ggplot2)

ui = fluidPage(
  "Motor cars",
  tags$div(
    plotOutput("plot", hover = "hover"),
    htmlOutput("tooltip"),
    style = "position: relative;"
  )
)

server = function(input, output, session) {
  output$plot <- renderPlot(qplot(wt, mpg, data = mtcars))

  output$tooltip <- renderText({
    req(input$hover)
    coords <- signif(c(input$hover$x, input$hover$y))
    htmltools::renderTags(
      tags$div(
        "x:", coords[1L], tags$br(),
        "y:", coords[2L],
        style = paste0(
          "position: absolute; ",
          "top: ", input$hover$coords_css$y + 5, "px; ",
          "left: ", input$hover$coords_css$x + 5, "px; ",
          "background: gray; ",
          "padding: 3px; ",
          "color: white; "
        )
      )
    )$html
  })

}

runGadget(ui, server)
解説: UI
Shiny でプロットした図から,マウスの座標に応じた情報を得られるようにする
これには,plotOutput にて hover 引数を指定する.指定した文字列は inputId として扱われるので,例えば hover = "hover" なら,サーバーサイドで input$hover から情報を取得できる.
hover に hoverOpts() を指定するとより細かい設定が可能になるが割愛する.
得られる情報は以下の通り.プロットの範囲外の場合は NULL が得られる.
List of 9
 $ x            : num 1.57
 $ y            : num 13.2
 $ coords_css   :List of 2
  ..$ x: int 86
  ..$ y: int 286
 $ coords_img   :List of 2
  ..$ x: int 86
  ..$ y: int 286
 $ img_css_ratio:List of 2
  ..$ x: int 1
  ..$ y: int 1
 $ mapping      : Named list()
 $ domain       :List of 4
  ..$ left  : num 1.36
  ..$ right : num 5.58
  ..$ bottom: num 9.46
  ..$ top   : num 34.8
 $ range        :List of 4
  ..$ left  : num 59
  ..$ right : num 589
  ..$ bottom: num 326
  ..$ top   : num 58
 $ log          :List of 2
  ..$ x: NULL
  ..$ y: NULL
input$hover を取得する Shiny App の例
runGadget(
  fluidPage(
    plotOutput("plot", hover = "hover"),
    verbatimTextOutput("hover")
  ),
  function(input, output, session) {
    output$plot <- renderPlot(plot(mtcars$wt, mtcars$mpg))
    output$hover <- renderPrint(str(input$hover))
  }
)
ツールチップをプロットと共に position: relative な <div> の中に入れておく
これによりツールチップに対して CSS を適用し,
position: absolute にした上で top と left を指定すると,親要素の左上を基準に位置を指定できるようになる.
ツールチップにしたい UI は動的な CSS を適用しやすい htmlOutput がお勧め.
後々のことだが top と left にはプロット上におけるマウスの座標を示す input$hover$coords_css$y と input$hover$coord_css$x を利用する.
ui = fluidPage(
  "Motor cars",
  tags$div(
    plotOutput(
      "plot",
      hover = hoverOpts(
        "hover", clip = FALSE, nullOutside = FALSE
      )
    ),
    htmlOutput("tooltip"),
    style = "position: relative;"
  )
)
解説: Server
プロットはいつも通り.
output$plot <- renderPlot(qplot(wt, mpg, data = mtcars))特殊なのはツールチップの作り方だろう.
output$tooltip <- renderText({
  req(input$hover)
  coords <- signif(c(input$hover$x, input$hover$y))
  htmltools::renderTags(
    tags$div(
      "x:", coords[1L], tags$br(),
      "y:", coords[2L],
      style = paste0(
        "position: absolute; ",
        "top: ", input$hover$coords_css$y + 5, "px; ",
        "left: ", input$hover$coords_css$x + 5, "px; ",
        "background: gray; ",
        "padding: 3px; ",
        "color: white; "
      )
    )
  )$html
})
まず,ツールチップの UI には htmlOutput を用いることにしたので,生な文字列を UI に送れるよう, renderText を使って文字列をレンダリングするようにする.
ただし,マウスがプロットの範囲外に存在しない時はレンダリングして欲しくない.このような時には req() を用いる.
req() に指定した値が NULL や FALSE の時,Shiny は移行の行の実効を中止する.つまり req(input$hover) なら input$hover が NULL の時にレンダリングを中止してくれる.
そして req() を満たした時のコマンドを書いていく.
最終的には
<div position: absolute; top: 10px; left: 10px;> tooltip </div>のような形を目指す.ごりごりと paste() していっても良いが楽したいので,tags$div() を使い,htmltools::renderTags() で HTML に変換するのがいいだろう.
ツールチップにただ tooltip と表示するのは面白くないので,マウス位置の座標を返すようにしてみる.
input$hover が返す座標はそのままでは桁数が多くで読み辛いので
coords <- signif(c(input$hover$x, input$hover$y))しておくことがポイントだ.
CSS の top 属性と left 属性には input$hover$coords_css$y と input$hover$coords_css$x 由来の値を指定するが,
+ 5 などの値を足して,マウス位置からずらしておいてやることがポイント.これにより,マウスがツールチップに重んなってしまい
- 読み辛くなる
input$hoverがNULLになってしまってツールチップが消えてしまう
といった問題を回避できる.
plotly パッケージを使う
とても簡単.
library(shiny)
library(plotly)
ui <- fluidPage(plotlyOutput("plot"))
server <- function(input, output, session) {
  output$plot <- renderPlotly(plot_ly(z = volcano, type = "heatmapgl"))
}
runGadget(ui, server)
jQuery を使う
Stack Overflow で紹介されている方法.
https://stackoverflow.com/questions/27965931/tooltip-when-you-mouseover-a-ggplot-on-shiny
以前は動作した気がするのだが,うまく動かない.他にも色々辛いところがあるが割愛.
以下は SO の解答の転載.
library(shiny)
library(ggplot2)

ui <- fluidPage(

  tags$head(tags$style('
     #my_tooltip {
      position: absolute;
      width: 300px;
      z-index: 100;
     }
  ')),
  tags$script('
    $(document).ready(function(){
      // id of the plot
      $("#plot1").mousemove(function(e){

        // ID of uiOutput
        $("#my_tooltip").show();
        $("#my_tooltip").css({
          top: (e.pageY + 5) + "px",
          left: (e.pageX + 5) + "px"
        });
      });
    });
  '),

  selectInput("var_y", "Y-Axis", choices = names(mtcars), selected = "disp"),
  plotOutput("plot1", hover = hoverOpts(id = "plot_hover", delay = 0)),
  uiOutput("my_tooltip")
)

server <- function(input, output) {

  data <- reactive({
    mtcars
  })

  output$plot1 <- renderPlot({
    req(input$var_y)
    ggplot(data(), aes_string("mpg", input$var_y)) +
      geom_point(aes(color = factor(cyl)))
  })

  output$my_tooltip <- renderUI({
    hover <- input$plot_hover
    y <- nearPoints(data(), input$plot_hover)[ ,c("mpg", input$var_y)]
    req(nrow(y) != 0)
    verbatimTextOutput("vals")
  })

  output$vals <- renderPrint({
    hover <- input$plot_hover
    y <- nearPoints(data(), input$plot_hover)[ , c("mpg", input$var_y)]
    # y <- nearPoints(data(), input$plot_hover)["wt"]
    req(nrow(y) != 0)
    # y is a data frame and you can freely edit content of the tooltip
    # with "paste" function
    y
  })
}
shinyApp(ui = ui, server = server) Atusy's blog