TL; DR
ggplot を対話的にしたい時, plotly::ggplotly() に食わせるのが面倒だから, + ggintearctive() すればいいようにした (改善した実装).
qplot(wt, mpg, data = mtcars) + ggtitle("マウスオーバーしてみてね") + gginteractive()はじめに
plotly::ggplotly() を使うと,カンタンに ggplot2 を使ったプロットを対話的にできる.ズームしたり,点の座標を読めるようになって便利だ.
ただし,利用には同関数に ggplot オブジェクトを与える必要がある.このため一度 plotly で必要な軸の範囲を調べてから ggplot として最終出力したいなんて時に不便だ.例えば以下の例では 3行目の ggplotly( と6行目の ) を最終出力時にコメントアウトしなければならない.
これは面倒なので, ggplot らしく最後にナニか足せば plotly 化できるようにしてみせよう.
library(ggplot2)
library(plotly)
ggplotly( # ggplotに戻すためにはコメントアウト
  ggplot(mtcars, aes(wt, mpg)) +
    geom_point()
) # ggplotに戻すためにはコメントアウト
実装
プロトタイプ
ggplot_add を利用し, plot + gginteractive() すればいいようにします
(参考: ggplot2の拡張パッケージをつくるのにggplot_add()が便利そう).
まず, "gginteractive" クラスを与えた plotly::ggplotly 関数を返す gginteractive 関数を定義する.
gginteractive <- function() structure(plotly::ggplotly, class = c("gginteractive", "function"))次に plot + gginteractive() を実行した時に呼ばれる ggplot_add.gginteractive を定義する.
ggplot_add.gginteractive <- function (object, plot, object_name) object(plot)plot + gginteractive() で対話的にできた.
qplot(wt, mpg, data = mtcars) +
  gginteractive()
改善したい点
plotly::ggplotlyはwidth,height,tooltipなど様々な引数を持つが,これらを利用できない非対話的に戻したい時は,以下のように
gginteractive()とその直前の+をコメントアウトしなければならない.qplot(wt, mpg, data = mtcars) # + # gginteractive()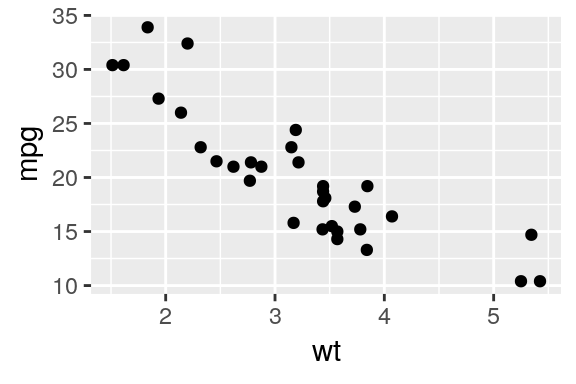
gginteractive()は最後に足さなければならない
最後のはちょっとどうすればいいかわからない.
改善した実装
gginteractiveの第一引数としてinteractiveを用意し,TRUEならばplotly化,FALSEならそのままになるようにする.gginteractiveに...引数を用意しここに与えた内容で,plotly::ggplotlyの初期値を変更しておく (purrr::partialの出番).
gginteractive <- function(interactive = TRUE, ...) {
  structure(
    if(interactive) {
      purrr::partial(plotly::ggplotly, ...)
    } else {
      identity
    },
    class = c("gginteractive", "function")
  )
}

ggplot_add.gginteractive <- function (object, plot, object_name) object(plot)
テスト
対話的・非対話的の切り替え
対話的
qplot(wt, mpg, data = mtcars) +
  gginteractive(TRUE) # TRUE なら明示しなくてもよい
非対話的
qplot(wt, mpg, data = mtcars) +
  gginteractive(
    FALSE # ここをコメントアウトするだけで対話的にできる
  )
ggplotly の持つ引数の利用
ツールチップに x 軸の情報だけを表示
qplot(wt, mpg, data = mtcars) +
  gginteractive(tooltip = "x")
ちなみに引数は前方一致できる.
qplot(wt, mpg, data = mtcars) +
  gginteractive(tool = "x")
応用 gghighlight とのコンビ
gghighlight はプロット中のデータの内,指定した条件にマッチするものを強調表示できるステキパッケージです.この時, gginteractive によって,どれをハイライトすべきか探索するには対話的にしておくと便利ですね.トドメに interactive = FALSE してやれば,清書がカンタン!
ちなみにgghighlight は強調したデータのラベンリグに ggrepel パッケージをりようできますが plotly::ggplotly は ggrepel に対応していないため,ごちゃごちゃ言われます.これが嫌な人は gghighlight(use_direct_label = FALSE) しましょう.
以下の例は gghighlight パッケージのドキュメントに載っているものに,+ gginteractive(...) しただけです.
library(gghighlight)
set.seed(2)
d <- purrr::map_dfr(
  letters,
  ~ data.frame(
      idx = 1:400,
      value = cumsum(runif(400, -1, 1)),
      type = .,
      flag = sample(c(TRUE, FALSE), size = 400, replace = TRUE),
      stringsAsFactors = FALSE
    )
)

ggplot(d) +
  geom_line(aes(idx, value, colour = type)) +
  gghighlight(
    max(value) > 20,
    # use_direct_label = FALSE # 対話的表示でごちゃごちゃ言われたくなければ利用
  ) +
  gginteractive(
    # FALSE # 非対話的にしたい時用
  )
## label_key: type## Warning in geom2trace.default(dots[[1L]][[2L]], dots[[2L]][[1L]], dots[[3L]][[1L]]): geom_GeomLabelRepel() has yet to be implemented in plotly.
## If you'd like to see this geom implemented,
## Please open an issue with your example code at
## https://github.com/ropensci/plotly/issues
## Warning in geom2trace.default(dots[[1L]][[2L]], dots[[2L]][[1L]], dots[[3L]][[1L]]): geom_GeomLabelRepel() has yet to be implemented in plotly.
## If you'd like to see this geom implemented,
## Please open an issue with your example code at
## https://github.com/ropensci/plotly/issuesgghighlight が plotly を念頭に設計されていないから (?) か,灰色になった系列のツールチップでは,idx, value, type が highlight..........1 みたいな感じに連番のツールチップに置き換えられてしまってます…….まあ使えないこともないかな?