Shinyでplotly.jsを使わずにインタラクティブな図を作れるのかなと思ったら、
「Shiny 100本ノック」の
【Shiny小技】グラフをダブルクリックすると情報が取得できる、dblclickOptsの紹介
を見つけました。
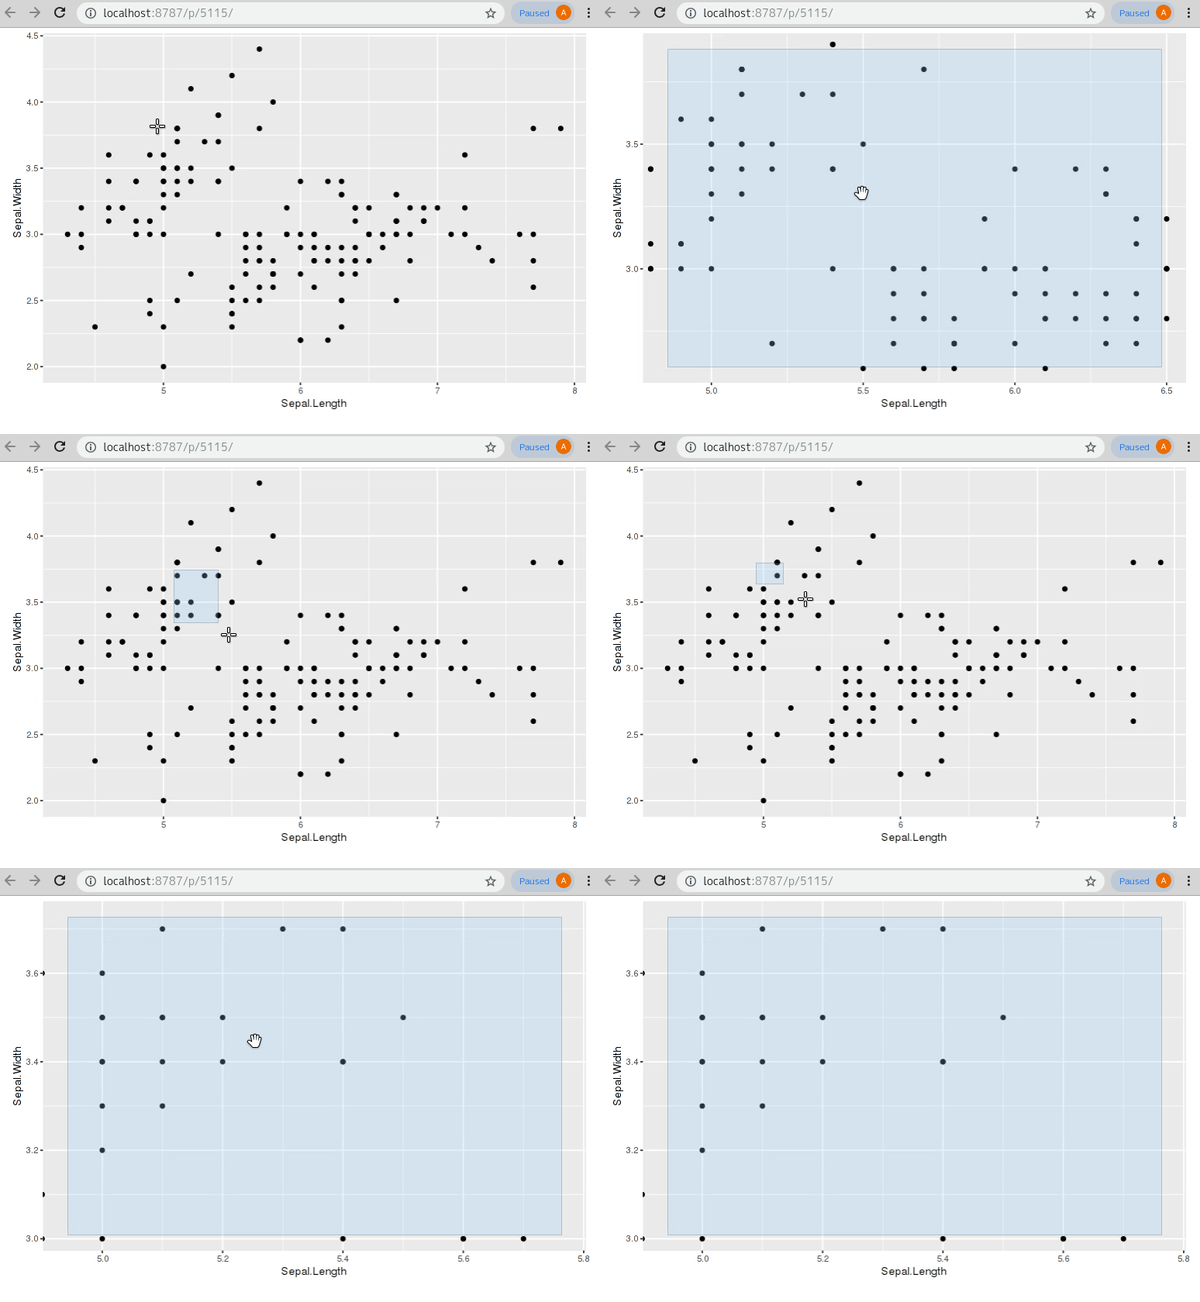
どうやら、 brushOpts なるものを使えば、 plot (ggplot2 を含む)
の拡大ができるようなので試してみました。

- 選択した領域を拡大
- 選択した領域を移動
- 選択した領域外をクリックすることで元のサイズに戻る
といったことができるようです。
dblclickOpts と組み合わせると、
拡大した領域内で点をダブルクリックして点の情報を取り出すことも可能みたいです。
library(shiny)
library(ggplot2)

u <- shinyUI(fluidPage(
  plotOutput(
    "plot",
    brush = brushOpts(id = "brush")
  )
))

s <- shinyServer(function(input, output) {
  output$plot <- renderPlot({
    qplot(Sepal.Length, Sepal.Width, data = iris) +
      coord_cartesian(
        xlim = unlist(input$brush[c("xmin", "xmax")]),
        ylim = unlist(input$brush[c("ymin", "ymax")])
      )
  })
})

runApp(list(server = s, ui = u))
 Atusy's blog